Market Chart
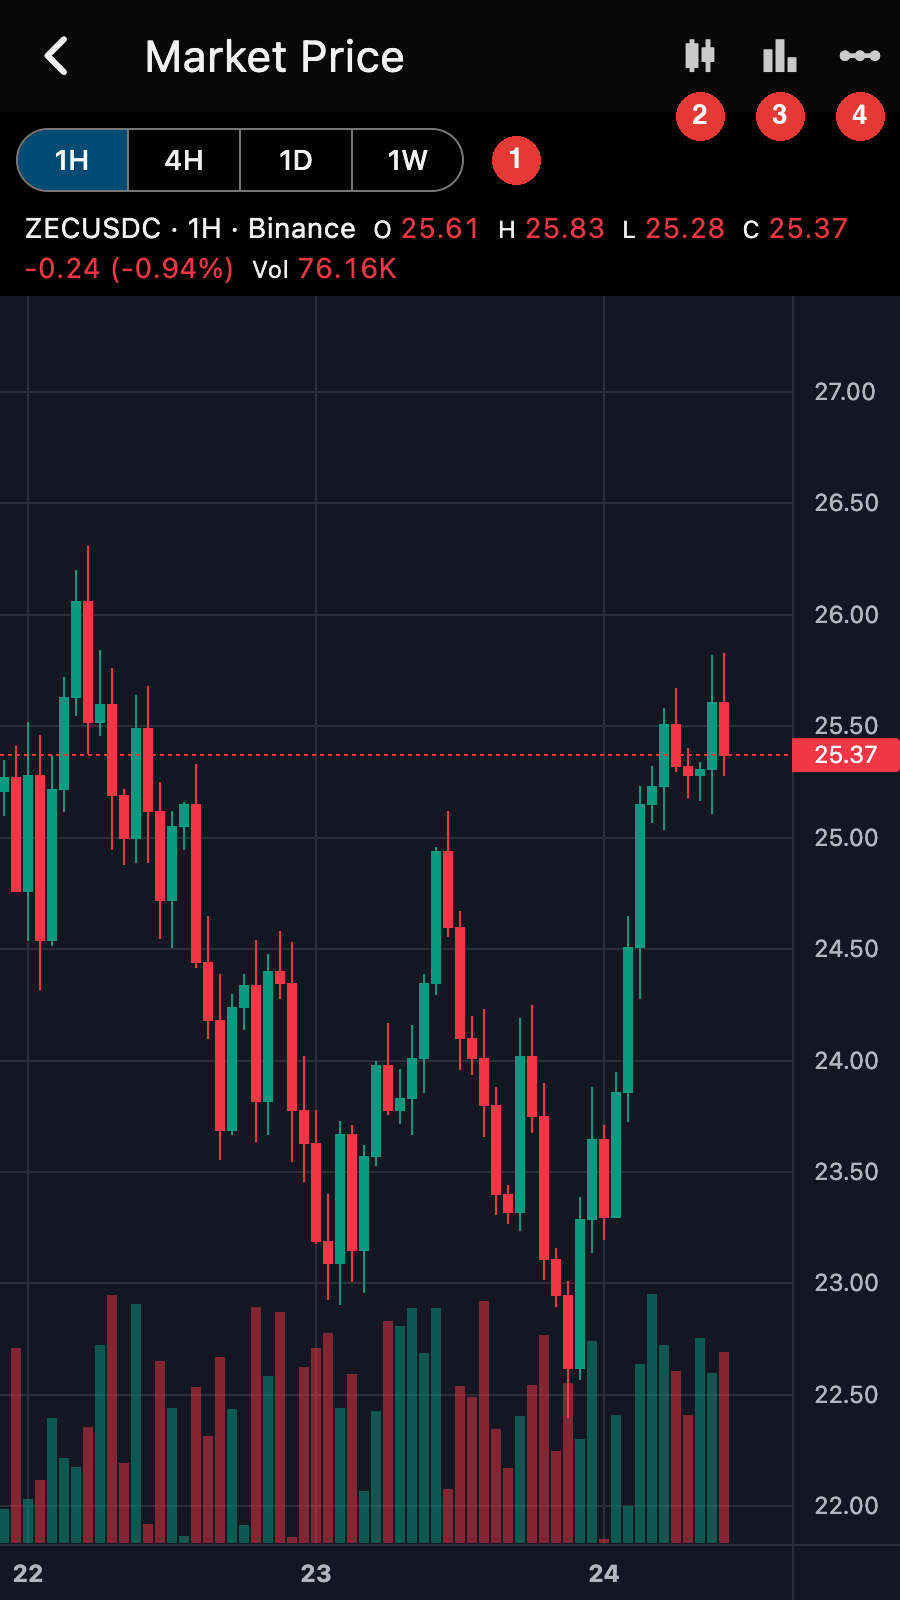
The market chart shows the ZEC price: the ZEC/USDC perpetual contract of Binance, which the app fetches itself and draws. It needs an internet connection.
Open it from the "Market Price" option of the account page menu.
- The interval of a bar: 1 hour, 4 hours, 1 day or 1 week.
- The chart style: candles, hollow candles, Heikin Ashi, bars, line or area.
- Show or hide the volume bars.
- Linear or logarithmic price scale.
The line above the chart gives the open, high, low and close of the latest bar, its change and its volume. Hover or touch a bar to read it there instead. Drag the chart to scroll back in time, and use the "Go to latest" button to come back to the forming bar. The interval and the style are remembered.